


The stock market is becoming America's primary source of wealth


Americans got $12.8 trillion richer in the second quarter of 2026. That's the largest quarterly increase in household wealth ever recorded in dollar terms, according to the Federal Reserve. Nearly $11 trillion of it came from rising stock prices and other financial assets, bringing total household equity holdings to a record $74 trillion.
And AI has a lot to do with it. Much of the market's recent enthusiasm has centered on expectations of enormous future earnings from artificial intelligence, sending technology stocks higher and substantially increasing the wealth of people who own them. Stocks have already overtaken real estate as the largest asset on American household balance sheets, and the gap is widening.
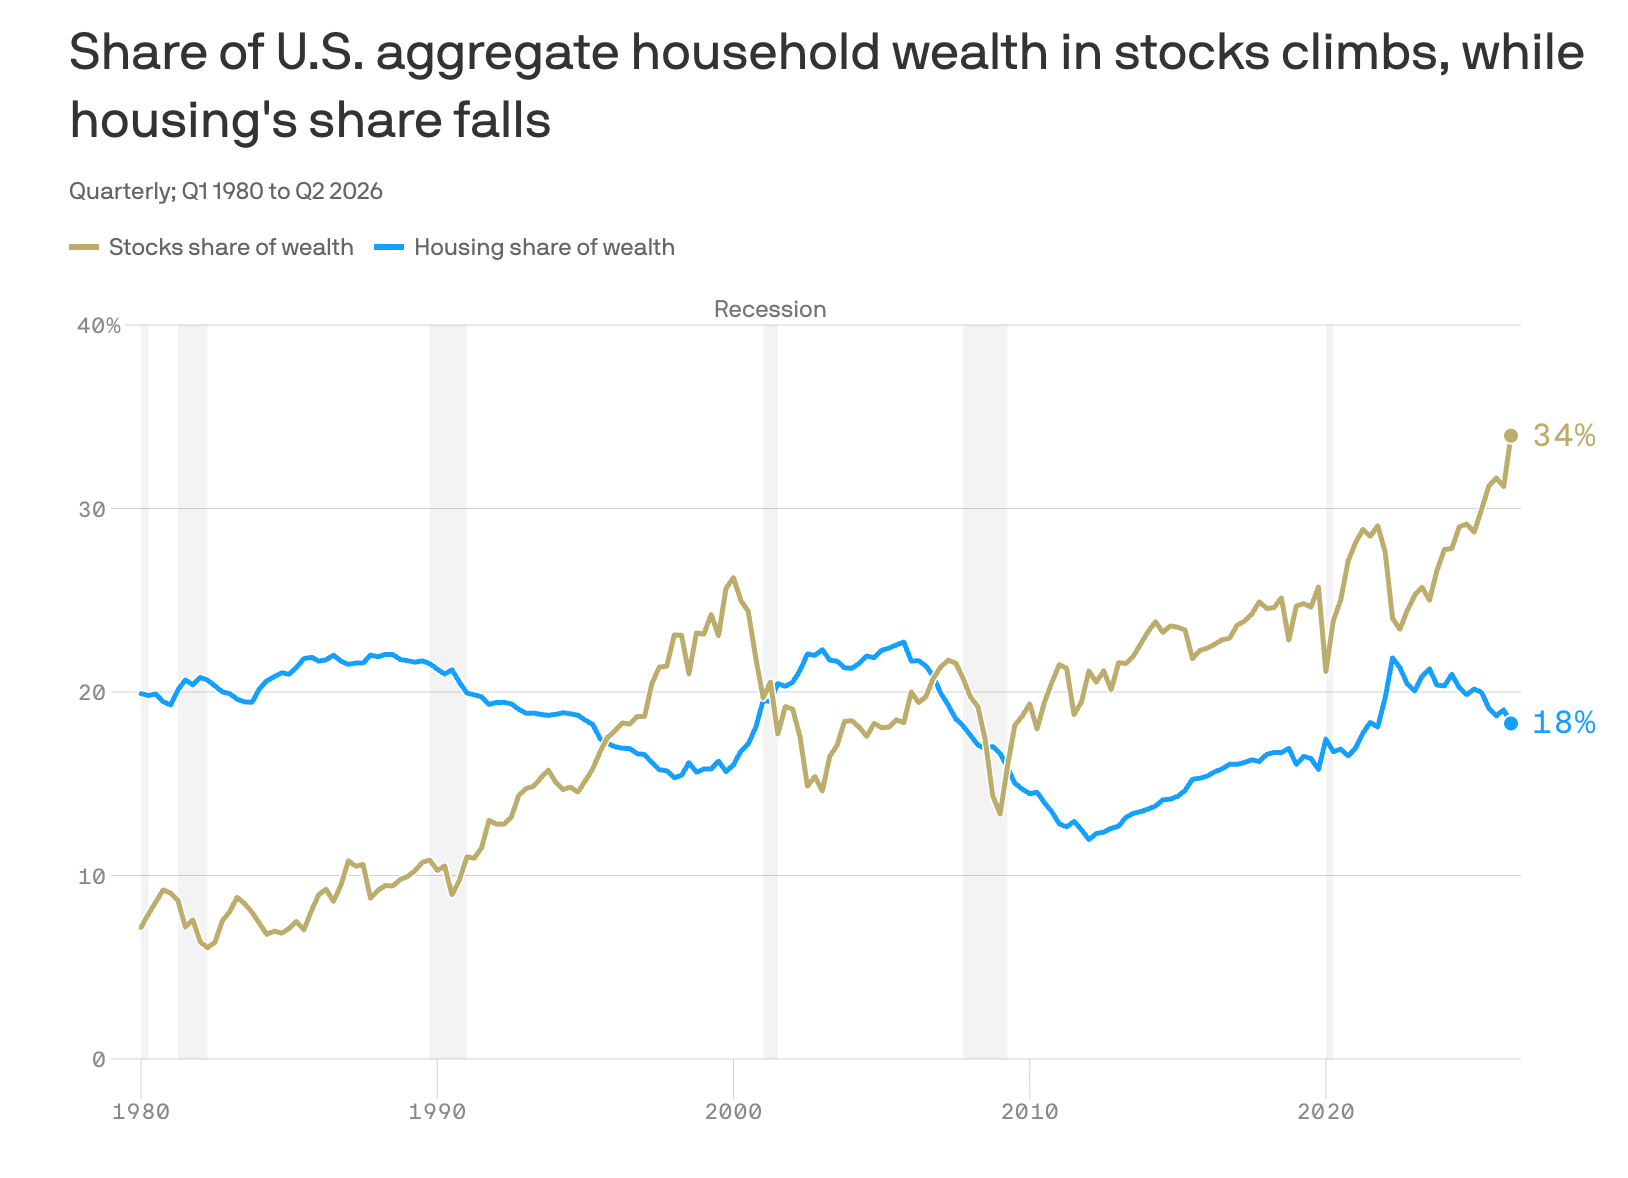
Visual source: Axios
This also helps explain something we've been discussing for months: Why do American consumers keep spending despite elevated inflation, relatively weak hiring, and persistently expensive borrowing? Economists call it the wealth effect. When investment portfolios appreciate, their owners tend to spend more, partly by withdrawing or borrowing against those assets and partly because they're simply more comfortable spending money when they feel wealthier. That effect is ultimately becoming increasingly relevant here. Krishna Guha, head of economics at Evercore ISI, estimates that rising wealth now accounts for roughly half of the growth in American consumption. Meanwhile, JPMorgan Chase found that the share of people making net withdrawals from investment accounts has doubled since 2019, with higher-income Americans over 65 leading the increase.
There is, however, a small matter to discuss: Who actually owns the stock market?
According to the Fed, the wealthiest 1% of Americans held approximately 51% of all stocks and mutual fund shares in the second quarter. The bottom 50% held just 0.6%. And the wealthiest 0.1% — roughly 137,000 households — now control nearly $28 trillion, or 15% of the country's entire household wealth. That's an average net worth exceeding $200 million per household.
And it's not as though the bottom half hasn't accumulated any wealth. It has, but the dollar amounts are almost comical by comparison. Between the end of 2024 and the second quarter of 2026, the wealthiest 0.1% gained an average of $29.76 million per household, adjusted for inflation. The broader top 1% gained $5.83 million per household. The bottom 50%? An average of $1,960. That's more than 15,000 times the difference between the very top and the bottom half. Collectively, the wealthiest 0.1% accumulated another $4.44 trillion in inflation-adjusted wealth over that period, compared with just $198 billion for the entire bottom half.
So yes, technically, the bottom half of America hasn't been left out of the boom; they’ve seen some “meaningful” percentage gains in wealth since the pandemic, helped by housing appreciation and pandemic-era financial support. But percentages only tell you so much when starting amounts differ radically. At the end of the day, the bottom 50% still owns just 2.3% of the nation's wealth.
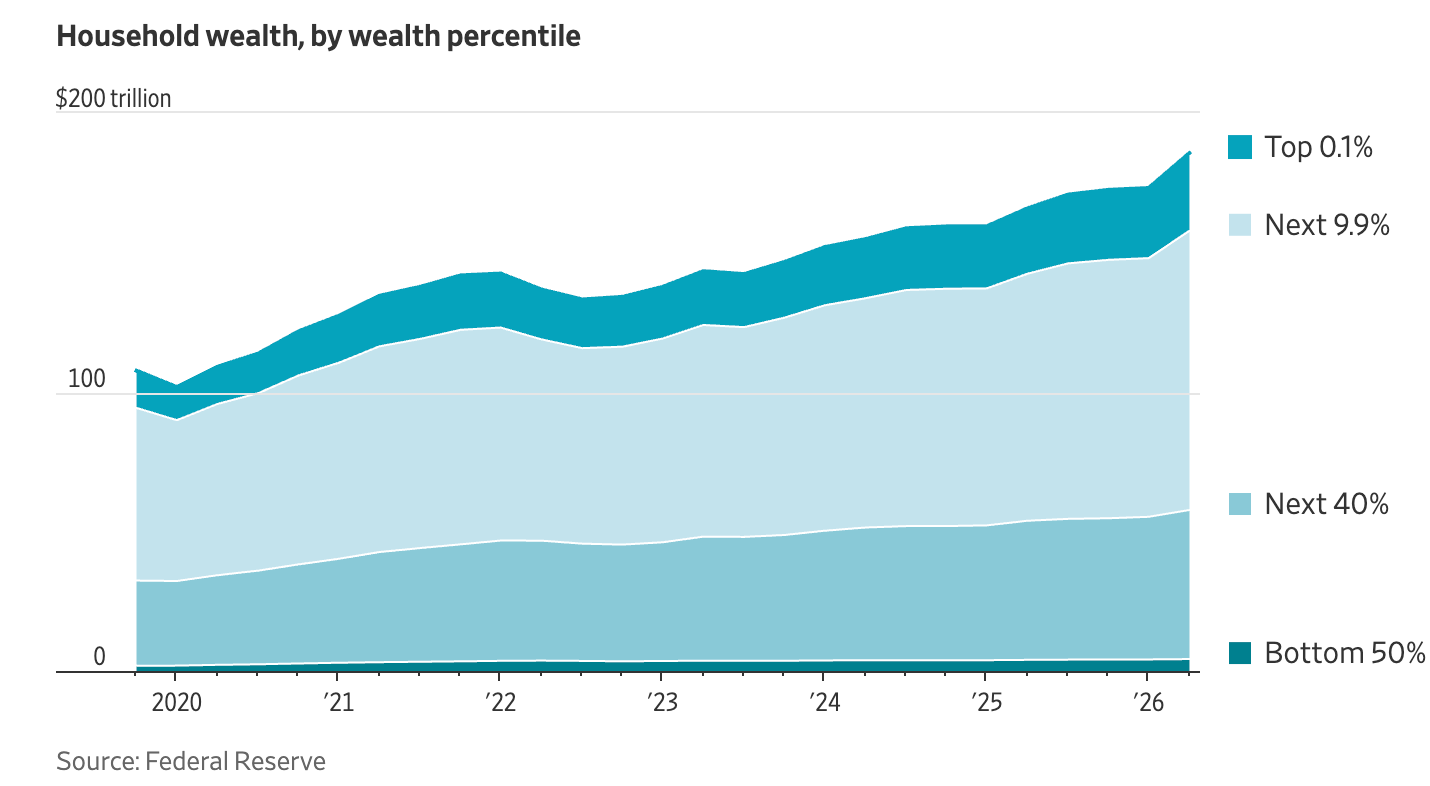
Visual source: WSJ
Now, what are we even saying here? That everyone should have the same amount of money? Absolutely not — this discrepancy has always existed, naturally, but it's worth pointing out and paying attention to when the gap starts to widen this much, because it creates a more precarious economy.
Rising stock prices are increasingly supporting consumer spending, which in turn spurs economic growth, but — and it’s a big but — those gains are concentrated among households that already have considerable financial resources, while Americans without meaningful investments remain much more dependent on wages and increasingly expensive necessities.
And the wealth effect works both ways — if stock prices fall, the damage doesn't necessarily stop with investors' portfolios. Spending supported by those portfolios can weaken too, potentially exposing just how much of the economy's recent resilience has depended on the market continuing to climb.
So, we all have to earn a living, yet that income is increasingly menial compared with the leverage created by owning assets.
Wages still pay the bills, but stocks, businesses, and other appreciating assets are doing much of the actual wealth-building — disproportionately so for people who already own plenty of them. With the stock market now helping support consumer spending and economic growth itself, Americans without meaningful investments are missing out on an increasingly important source of financial progress.
Of course, that arrangement also leaves the economy more exposed to the next market downturn. For now, though, the message is becoming difficult to ignore: own assets, or risk getting left behind.
Answers to your questions
Yes. WealthLuma offers partner access so you can manage your finances together at no additional cost. You’ll be able to filter transactions by member—making it easy to see which spending is yours and which belongs to your partner.

Yes. You can edit existing transactions and add new ones directly in WealthLuma, so your records stay accurate and personalized.
Origin connects securely through trusted partners including Plaid, MX, and Mastercard.
Yes. WealthLuma supports CSV uploads. You can upload a .csv file of your transactions, and we’ll import them into your account.
Yes. Your data is protected with bank-level security and advanced encryption. When you connect accounts through WealthLuma, your login credentials are never shared with us. Instead, our partners generate secure tokens that let WealthLuma access only the data you authorize—keeping your personal information private while enabling personalized insights.
Yes. You have full control to organize your spending in WealthLuma. Transactions are automatically categorized by WealthLuma, but you can always edit categories, add your own tags, and filter transactions however you like—so your spending reflects the way you actually manage money.